
New Phenologies
Tega Brain

ENERGY STATES AND INFORMATION STATES
In 1856, little-known American scientist Eunice Foote gathered an air pump, two glass jars, and four thermometers. Placing two thermometers inside of each jar, she pumped one full of carbon dioxide and filled the other with plain air. She then put them both in the sun to warm. Recording the temperature change in each, Foote noticed something strange—the jar with carbon dioxide became much hotter than the jar with air, and it stayed like that for a longer period of time. And with that, she made the first scientific observations of the greenhouse effect.1 In her publication on this work, Foote speculated that “an atmosphere of that gas would give to our earth a high temperature,” foregrounding the way in which climate change is most commonly understood—as a matter of thermodynamics and entropy.
Thermodynamics is an area of science concerned with the relationship between heat and other forms of energy; within this context, the term entropy specifically describes how energy is distributed across a system. The concept of entropy explains why a system will rearrange itself to disperse energy evenly throughout. We see it at work when a drop of ink diffuses evenly through a body of water, when two different gases gradually mix with each other, or when heat naturally distributes itself across a material. Entropy, as it is understood in thermodynamics, describes the energetic behavior of a system—how it will materially reconfigure itself until an equilibrium is reached.
Now, more than 160 years after Foote’s experiment, we are in the midst of a reconfiguration of every system on Earth, where unprecedented levels of carbon dioxide are driving catastrophic entropic changes. As our atmosphere absorbs more heat, more energy is diffused into the oceans and soils, causing phenomena like polar ice retreat, glacial and tundra melt, and desertification. In light of these massive environmental shifts, it is hard to overstate the importance and urgency of continuing to build a robust public understanding of the processes underlying climate breakdown, as well as the far-reaching and multi-layered effects of the catastrophe. At stake are not only the thermodynamic conditions on Earth, but also what we know of our world. A changing climate diminishes our knowledge of Earth’s systems, as they shift to a state humans have never observed or experienced. These informational impacts can be considered via a second definition of entropy, one developed in the field of information science.
In 1948, the mathematician Claude Shannon published A Mathematical Theory of Communication, a book that established information science as a field, and that proposed a definition of entropy based on the quantification of information. Shannon argued that the more information a system contains, the more uncertain its outcome and the higher its entropy. Shannon’s entropy, also known as information entropy, is a measure of uncertainty or predictability. The story goes that when Shannon was writing up his work—connecting communications theory with electrical systems—he noticed similarities between his equations describing information and those describing energy in thermodynamics. In discussions on what to call this new measure for information, his colleague, the well-known computer scientist John von Neumann, suggested the term entropy, arguing that it would be ideal because “no one really knows what entropy is.”2
Indeed, the concept of entropy continues to be a source of much confusion due to its multiple uses across different disciplines. For Shannon, entropy is the probabilistic measure of uncertainty, or the amount of possible states available in a system. Imagine tossing a coin: there are two possible outcomes or states—heads and tails.3 On the one hand, if this coin was a trick coin, with a head on both sides, its entropy would be zero, as the outcome is perfectly predictable. A die, on the other hand, has a higher entropy, because it can arrive in six possible states, making the result more uncertain and harder to predict.
Climate change can be understood in relation to both definitions of entropy. From a thermodynamic perspective, Earth’s environments are transitioning to higher energy states, or becoming more entropic in a material sense. From the perspective of information science, this shift has implications on what we know and what we can predict about environmental patterns and processes.4 The increase in thermodynamic entropy leads to an increase in informational entropy. To put this another way: a warmer climate disrupts the conditions of the Holocene, the relatively stable geological era of the past 12,000 years that has enabled agriculture and dense, sedentary communities to develop. Our environmental datasets are historic archives of the patterns and cycles of a Holocene climate, archives that we have used to build the infrastructures and technologies of the present. As Foote’s work highlights, it has been possible since the Industrial Revolution to predict that higher atmospheric carbon dioxide concentrations will produce warming, but this same warming increases the information entropy of environments, thereby diminishing the relevance of what we know of the world.
EARLY ARRIVALS, LATE DEPARTURES
The timing of recurring events—such as flowering, fruiting, or migration—in the life cycles of other species is known as phenology. This is the study of patterns, rhythms, and evolved temporal interdependencies between multiple lifeforms. Phenological events are largely contingent on climate conditions like day length, temperature, and weather, making them rich indicators of the biosphere’s response to climate change. As a relational concept, phenology shows how ecological health is contingent on the temporal coordination between species within the conditions of the Holocene.
The practice of observing recurring environmental patterns builds an ecological perspective of time constituted by cycles and relationships rather than the steady, linear march of machines. Indeed, prior to the spread of machines and engines, time was once wholly determined by the observation of environmental and astronomical dynamics, as recalled by the work of Carl Linnaeus, who is best known for developing the modern system of biological taxonomy. In his 1751 treaty Philosophia botanica, Linnaeus linked phenology to climate, and popularized ways of tracking time through observing the behaviors of flowers.5 His annual calendars and flower clocks are based on extensive field observations of different flowering patterns. He divides flowering plants into three groups: the meteorici open and close in response to the weather; the tropici are influenced by the length of the day; and the aequinoctales have fixed times for opening and shutting. Linnaeus claimed that one could tell the time of day with exquisite accuracy by planting a garden with a particular mix of species from the aequinoctales group and although contemporary botanists refute this, he is responsible making botanic timekeeping wildly popular in 19th-century France.
Phenology is one of the oldest branches of environmental science. One of the longest continual phenological records, for example, observes the flowering of the cherry blossom in Japan. This dataset has been pieced together from records of the Royal Court in Kyoto, kept since 705 AD, as well as the diaries of emperors and ancient aristocrats documenting the start date for the annual cherry blossom festival.6 The date of this important event in Japanese society provides a reliable record of the behaviors of the cherry tree, as the festival is always timed to coincide with the tree’s peak bloom day.
Of course there are many more historic festivals held in celebration of the lifecycle events of different species, such as the numerous Italian sagras traditionally held at the harvest of a fruit or vegetable. However, the cherry bloom is a valuable indicator of historic climate patterns as it is a function of temperature—specifically, it is triggered by a run of warm days in early spring. This archive therefore serves as a valuable proxy for historic temperature patterns over the past millennia and provides particularly stark insights: since 1983, the Japanese cherries have progressively flowered earlier every year, and since the early 1990s, the flowering dates have been earlier than any time in the last 1,200 years.7
As flowering times shift in response to changing climates, the risk of phenological mismatch increases. Phenological mismatch—also known as ecological mismatch—occurs when seasonally coordinated events like flowering and pollinator activity shift out of sync. For example, flowering plants depend on pollinators like insects to sexually reproduce, and in turn, these pollinators rely on annual flowering cycles for their food supply. In a 15-year study on the flowering patterns of eucalypts, a group of Australian ecologists observed how within this genus of trees, the different species have staggered their bloom dates so that flowering is spread throughout the entire year. The primary pollinators of eucalypt trees are a type of vegetarian bat known as the flying fox, who feed on the eucalypt’s blossom—the striking temporal distribution in the flowering of these trees means that the flying fox has a reliable year-round food supply. This type of mutualistic relationship is what theorist Anna Tsing calls ‘collaborative survival.’8 The flying foxes do the eucalypts a great service, inadvertently moving their pollen over thousands of miles, from forest to forest, and community to community. To return the favor, the trees collectively ensure that the flying foxes always have something to eat. This interdependence also manifests in the physiology of both parties. The flying foxes’ eyesight is sensitive to parts of the light spectrum that correspond to the colors of the blossoms, and eucalypts tend to release nectar at night, during the times when the nocturnal flying foxes are active.9
The flowering patterns of eucalyptus trees are sensitive to many variables, including rainfall and wildfires, and with climate change bringing warmer and drier conditions to eastern Australia, these patterns are shifting in ways that reduce the reliability of the flying foxes’ food supply. By extension, this also compromises the eucalypt’s ability to reproduce without human intervention. From the perspective of these two species, a warming atmosphere reduces the predictability and reliability of their food and reproductive infrastructures. Thermodynamic entropy produces information entropy and threatens their means of collaborative survival.

HOW TO SIZE A PIPE
Manipulating the climate, whether by accident or design, changes the relations between all lifeforms and compromises the ecological integrity of the biosphere. These disruptions are in no way only confined to the lives of other species. New phenologies also compromise age-old interdependencies among human societies and the systems of infrastructure built to support us. Human-technology relations are as finely tuned to Holocene climate conditions as those of the eucalypts and flying foxes. Oft-overlooked infrastructures like bridges, roads, pipes, and dams are material negotiations with specific environmental contexts, typically designed as attempts to manipulate or control. A bridge isn’t just a pathway over a river, it is also a wager on how high the river might rise in times of flood. A road isn’t just a smooth surface for driving, it is also an artery for transporting rainwater during a storm. The height of gutters on a street are a bet on how much water might flow. These concrete forms emerge through design decisions that are informed by historical weather data, and used to predict the range of future weather conditions.
Meteorology is a field that is directly engaged with the information entropy of the atmosphere; it is concerned with both the collection of weather data and its utilization in prediction. Historian Paul Edwards traces the multi-century project of weather prediction in his book A Vast Machine, in which he highlights how the statistical demands of this field have driven developments in information and computational technologies, orienting them towards the task of prediction. In the early days of computing following World War II, scientists like John von Neumann applied machines like the Electronic Numerical Integrator and Computer (ENIAC)—the first general-purpose computer—to the analysis of weather data in order to make predictions faster. Today, less than a century later, this endeavor has produced a sophisticated system of planetary computation that collects and processes observations of a climate that is now deviating from historic norms.
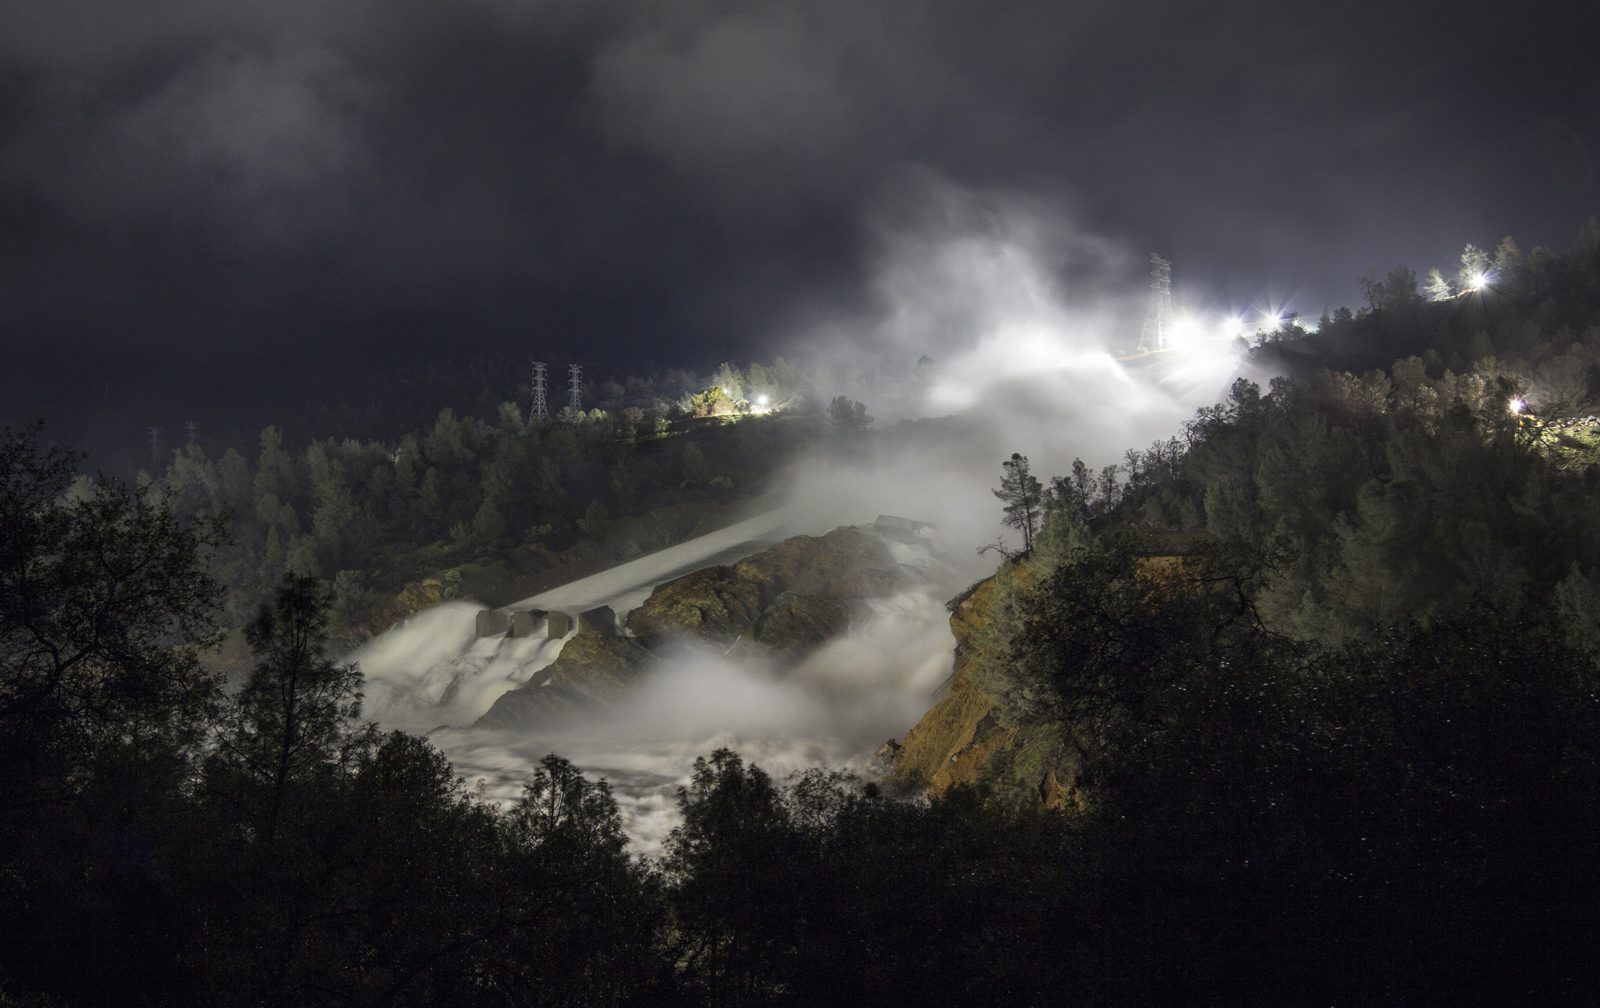
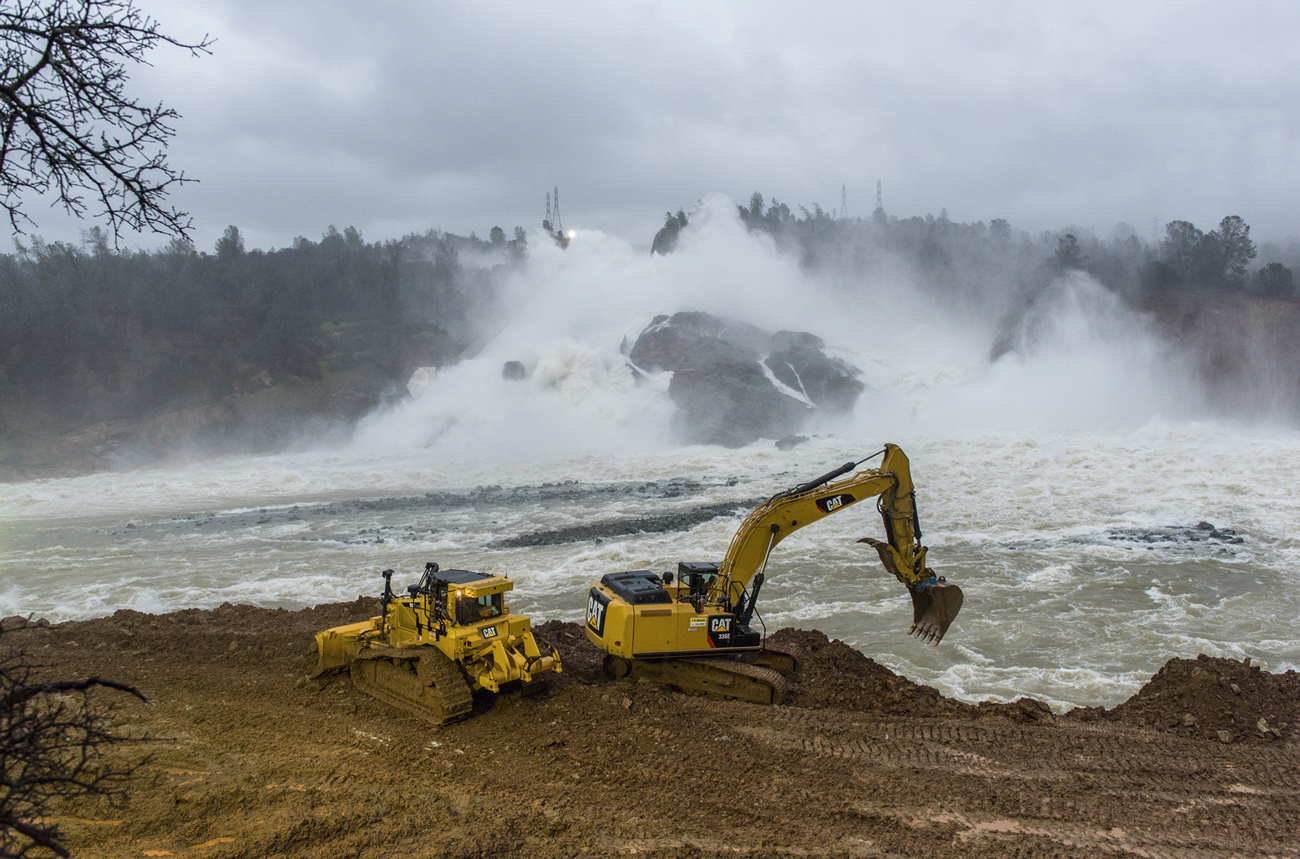
When weather patterns diverge from historical norms, infrastructures fail. This is obvious when unusually intense hurricanes like Katrina or Sandy cause lethal damage to human communities via overflowing levees or flood control structures, but it is more subtly at play in events like the Oroville Dam scare in Northern California. In the early months of 2017, the dam’s watershed received more than twice its average rainfall, as well as increased snowmelt caused by warmer than average temperatures.10 With significant flows coming into the dam, engineers first tried to lower water levels by diverting water out over the main spillway. However, by early February, the spillway had cracked and a huge, rapidly eroding hole had opened up about halfway down the chute. With more rain falling in the watershed, dam managers now faced a dilemma: continue to use the spillway and risk chunks of concrete breaking off and hurtling downstream, or engage the dam’s second, emergency spillway that had never been tested in its 49-year existence. Emergency spillways are typically used less than once in a lifetime, and the engineers who built the Oroville Dam in the 1960s were not likely to still be alive to witness its second spillway in use. As dam water levels continued to rise, water would overtop the emergency spillway whether the engineers planned for it or not, and so power lines and trees were hastily cleared from its slope, and water was sent over the edge.
These outflows helped reduce dam levels. However, after two days, the slope of the emergency spillway also started to erode. If it were to fail, the dam would release an uncontrolled wave of water and cause massive flooding in downstream communities, and so the 200,000 people living below it were evacuated for the first time in the dam’s history. Fortunately, the structure held and the dam levels fell below the spillway’s crest height, averting the danger. Unlike one-off catastrophic storm events like hurricanes, the Oroville incident occured due to the cumulative effect of several deviations in local climate conditions—the higher than average rainfall combined with the higher than average snow melt, along with problems of engineering and maintenance at the main spillway.11 Despite this, reporting on the incident largely frames it as a failure in engineering alone,12 with very few commentators pointing to the effects of changing precipitation patterns in the region, making it difficult to implement appropriate response mechanisms to future overflow scenarios.13
Dams, spillways, drains, and even gutters are designed by using historic rainfall patterns to model the future conditions that these structures may have to withstand. For a water engineer, this means sizing drains and dams so that they don’t overflow and cause flooding too often. But how often is too often? A gutter is typically designed to flood once every five years—in theory. Known as the design storm of the structure, this is the maximum amount of water that it is designed to be able to accommodate. To calculate the flows for the design storm, the land area upstream of the structure is measured. Past rainfall data is then used to calculate how much water could potentially land in this area and come gushing to the structure. In the case of dams, the consequences of failure are so high that they are designed for a storm that would only occur with a frequency of once in 500 years or even less often. However, an interval of 500 years is a much longer period of time than the span of our longest rainfall records. In most places we only have reliable rainfall data from the past 150 years or so, and therefore calculating flows for a 500-year storm requires modelling techniques that simulates rainfall patterns into the future.14 As patterns shift and change in ways that have not been seen for 12,000 years or more, the predictive potential of the data we have to build and calibrate these simulations diminishes.15
Water infrastructures like dams and culverts are designed in direct dialogue with their local environments. They are relational structures that were fine-tuned to their surroundings at the time of construction, and now these surroundings are rapidly changing. Climate change is decoupling our systems from their climatic niches and causing a type of phenological mismatch in human infrastructures. This produces what I call climate failures—that is, the infrastructural mismatches caused by changing rainfall patterns or temperature ranges. At first glance, climate failures may appear to be conventional engineering failures, systems overflowing or breaking down due to bad design or inadequate maintenance. However, upon closer study, they reveal themselves as failures produced by environments changing faster than we can accommodate, adapt, or prepare for.
Water engineering departments are faced with the question of how to address the growing information entropy in our environments on a daily basis. Should our dam spillways be upgraded for the design storm as calculated in 2019, or the design storm based on the forecast of climate conditions of 2119? How well can we tell what this storm will be? Some in the field believe we should be simply designing the largest structures we can possibly afford at the time, but even this approach throws up thorny questions of resource availability and distribution.
The present climate emergency entwines two entropies: thermodynamic and informational. At the time of writing, atmospheric carbon concentrations have reached 415 parts per million for the first time in about 3 million years and yet in the United States, we are continuing business as usual.16 Loading the atmosphere with carbon dioxide is akin to adding faces to a die. Just as the collaborative survival of species like flying foxes and trees is coordinated by climatic cues and patterns, human knowledge systems and the technologies built within them are equally tethered to Holocene climate patterns. Look around and you’ll notice that our infrastructure, not only the dams and drains, but also our traditions and cultures—all emerge in direct dialogue with our environment. The reluctance of our governments and industries to confront this reality, particularly those leading affluent nations like the United States and Australia, will cause our human systems to fail more frequently. And when these infrastructural mismatches do occur, we must acknowledge that they are climate failures caused by the inaction of those shaping our industrial and political systems. These failures reflect centralized structures—nation-states, big infrastructure, monopolistic industries—projects of technological and environmental control. They represent a model of survival based on prediction, control, and human dominance at all costs. However, this approach is now driving the system beyond the bounds of its own models.
The increase in information entropy of Earth undermines the relevance of our data and knowledge of the world, a process that will continue as the conditions that co-constituted our biosphere drift further towards some new unfamiliar state. A shift in climate is also a shift in epistemology, and the stakes are high. Each new month now brings unprecedented weather patterns and extreme events. And as we turn to each other to ask, “Was it this hot last year?” we must read these experiences as urgent imperatives to act, to change, and to seek a different model of collaborative survival with the lifeforms around us.
-
Foote’s publication predates Irish physicist John Tyndall’s work by several years, but despite this, Tyndall remains widely credited for first observing the warming effect of carbon dioxide. ↩
-
Jeremy R.H. Tame, Approaches to Entropy (New York: Springer, 2019). ↩
-
A system with two possible states contains the smallest unit of information, known as a ‘bit’. ↩
-
See William B. Gail’s New York Times opinion piece, “A New Dark Age Looms” (2016), which references Attribution of Extreme Weather Events in the Context of Climate Change, a 2016 report on the increasing frequency of extreme weather events published by the National Academies of Science and Engineering. Also see James Bridle’s similarly titled New Dark Age: Technology and the End of the Future (New York: Verso, 2018). ↩
-
Carl Linnaeus, Linnaeus’ Philosophia Botanica, trans Stephen Freer (1751; repr., Oxford: Oxford University Press, 2003). ↩
-
Annette Menzel, “Phenology: its importance to the global change community,” Climatic Change 54, no. 4 (2002): 379-385. ↩
-
Richard B. Primack, Hiroyoshi Higuchi, and Abraham J. Miller-Rushing, “The Impact of Climate Change on Cherry Trees and Other Species in Japan,” Biological Conservation 142, no. 9 (2009): 1943-1949. ↩
-
Anna Lowenhaupt Tsing, The Mushroom at the End of the World: On the Possibility of Life in Capitalist Ruin (Princeton: Princeton University Press, 2015). ↩
-
Leslie S. Hall and Gregory Richards, Flying Foxes: Fruit and Blossom Bats of Australia (Sydney: UNSW Press, 2000). ↩
-
Data from the Department of Water Resources, California Data Exchange Center. Online: https://cdec.water.ca.gov/cgi-progs/products/PLOT_ESI.pdf ↩
-
Jessica Pupovac, “Aging and Underfunded: America’s Dam Safety Problem in Four Charts,” National Public Radio, October 11, 2015, http://www.npr.org/2015/10/11/447181629/aging-andunderfunded-americas-dam-safety-problem-in-4-charts. ↩
-
Aristotelis Koskinas et al., “Insights into the Oroville Dam 2017 Spillway Incident.” Geosciences 9, no. 1 (2019): 37. ↩
-
Xingying Huang, Alex D. Hall, and Neil Berg, “Anthropogenic warming impacts on today’s Sierra Nevada snowpack and flood risk,” Geophysical Research Letters 45, no. 12 (2018): 6215-6222. ↩
-
About a decade ago, the best design practice in the storm water engineering industry was to model one rainfall pattern when designing a structure. However, in 2017, best practice guidelines were updated to recommend 10-20 different rainfall patterns to be modeled in the design process. This is a 10-fold increase in modeling work and requires a corresponding increase in labor and computational resources. In the model, you also have to take into account many other conditions, like what the ground in the water shed is made from—i.e. you are going to get much more runoff from a concrete parking lot, compared to a forest floor. Other factors like how wet the watershed already is, are also significant—if the ground is fully saturated, you are going to have much more water flowing off it much faster. For some of these predictions, like those of watershed saturation, there remains relatively little guidance for modeling, making design challenging. ↩
-
The study of historic climates is known as paleoclimatology. This relies on methodologies such as ice core analysis, where air bubbles trapped in ice laid down up to 800,000 years ago provide samples of air chemistry, and tree ring analysis, where the width of tree rings give an indication of annual precipitation and temperature. ↩
-
Meilan Solly, “Carbon Dioxide Levels Reach Highest Point in Human History,” Smithsonian Magazine, May 15, 2019, https://www.smithsonianmag.com/smartnews/carbon-dioxide-levels-reach-highest-point-humanhistory-180972181/ ↩


